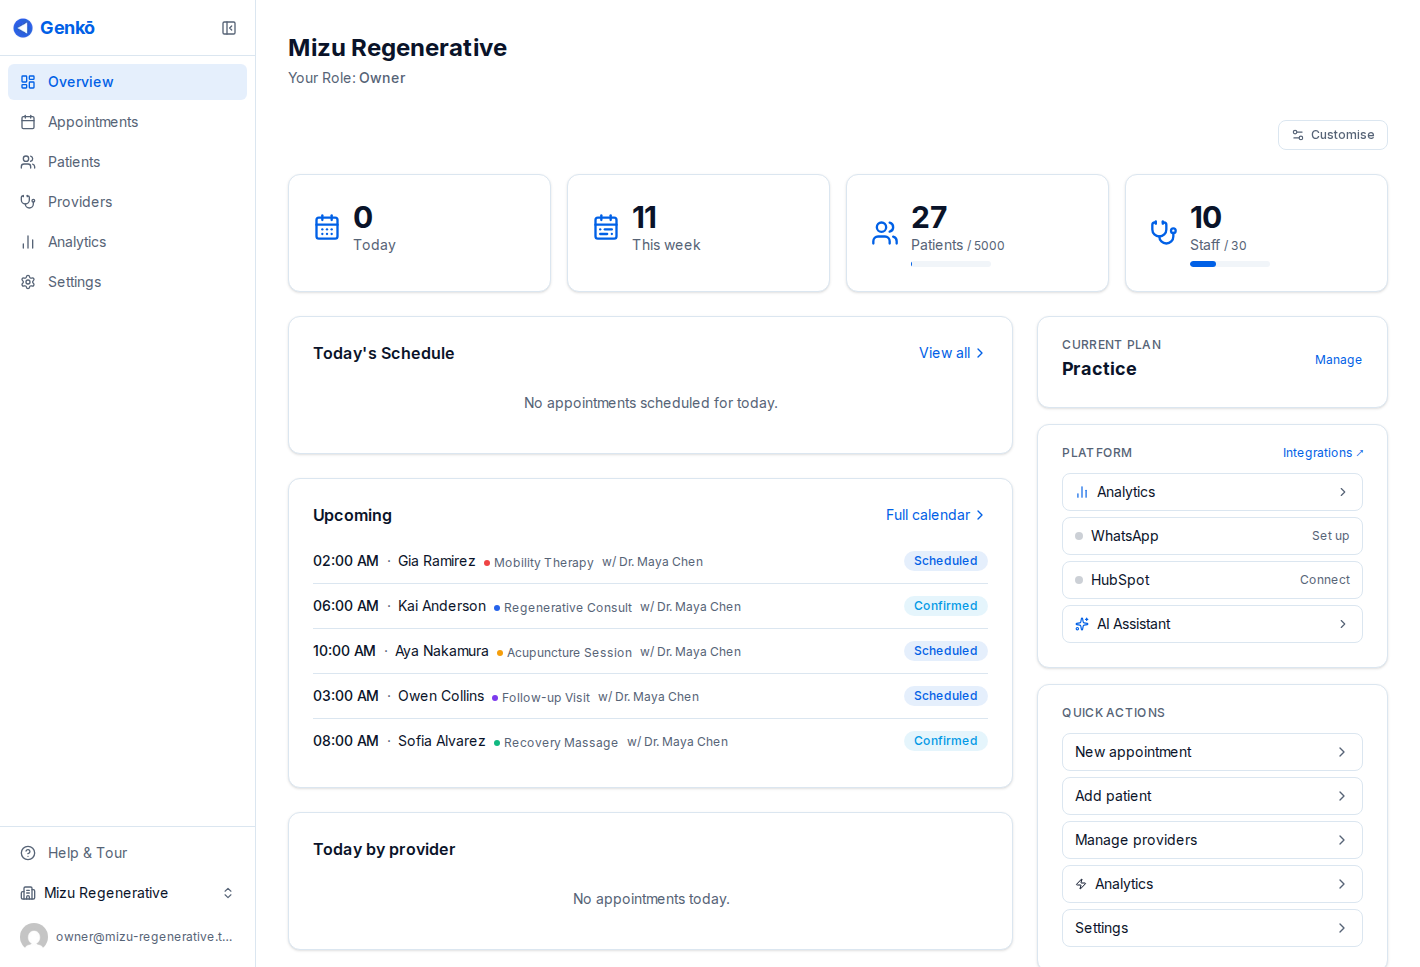
Dashboard Overview

The Dashboard is your command center in Genkō. It provides a quick overview of your clinic’s daily operations and important metrics.


Accessing the Dashboard

  • The Dashboard is your default landing page after login
  • Click Dashboard in the sidebar or the Home icon in breadcrumbs to return anytime
  • URL: /admin/dashboard

Dashboard Sections

1. Greeting Header

At the top of the dashboard, you’ll see:

  • Personalized greeting: “Good morning/afternoon/evening, [Your Name]”
  • Today’s date: Formatted for your locale (e.g., “Monday, January 9”)
  • Organization name: Your clinic’s name displayed in the corner

2. Onboarding Wizard (New Users)

If you haven’t completed onboarding, you’ll see the Onboarding Wizard banner:

  • Shows your setup progress percentage
  • Lists completed and pending setup steps
  • Click on any step to navigate directly to that section
  • Can be expanded/collapsed and dismissed when complete

Onboarding Steps:

  1. Welcome (auto-completed)
  2. Complete your profile
  3. Add your first patient
  4. Invite your team
  5. Schedule an appointment

3. Urgent Alerts (When Applicable)

If there are critical items requiring attention, they appear in a red alert box:

  • Overdue appointments
  • Expiring licenses
  • Payment issues
  • Critical patient updates

Click on any alert to address the issue directly.


4. Quick Stats Cards

Three key metrics are displayed as clickable cards:

Metric Description Click Action
Total Patients Number of registered patients Opens Patients page
Today’s Appointments Scheduled appointments for today Opens Scheduling page
Telemedicine Sessions Video consultations today Opens Telemedicine tab

Each card shows:

  • Current count/value
  • Visual icon
  • Hover effect for interactivity

5. Today’s Schedule

The main content area displays your daily schedule:

When Appointments Exist:

  • List of upcoming appointments for today
  • Patient name
  • Appointment time
  • Appointment type (Regular/Follow-up)
  • Status badge (Scheduled, Confirmed, In-Progress, Completed, Cancelled)

When No Appointments:

  • Friendly message: “No appointments scheduled”
  • Quick action button: “Create Your First Appointment”

Schedule Actions:

  • Click “View All” to go to the full Scheduling page
  • Click any appointment to see details

6. Quick Actions Panel

A sidebar panel with shortcuts to common tasks:

Action Description
Add Patient Opens the new patient form
Schedule Appointment Opens the new appointment modal
Start Telemedicine Opens telemedicine dashboard

Each action includes:

  • Clear icon
  • Title
  • Brief description
  • Hover animation

7. Informational Alerts

Non-urgent notifications appear in a separate section:

  • System updates
  • License renewal reminders
  • Feature announcements
  • Tips and suggestions

Color-coded by type:

  • 🟡 Yellow border: Warnings
  • 🔵 Blue border: Information

8. Profile Completion Banner

At the bottom, a Profile Completion Banner may appear if your business profile needs attention:

  • Shows percentage of profile completion
  • Lists missing information
  • Direct link to complete your business profile
  • Disappears once profile is complete

Dashboard Tips

Best Practices

  1. Check Daily: Start each day by reviewing your dashboard
  2. Address Alerts: Handle urgent alerts immediately
  3. Complete Profile: A complete profile improves patient trust
  4. Use Quick Actions: Save time with one-click shortcuts

Customization

The dashboard adapts based on:

  • Your role (Admin sees more options than Staff)
  • Your organization’s settings
  • Current date and time
  • Your locale/language preference

From the dashboard, you can quickly access:

Destination How to Access
Patients Click “Total Patients” card or sidebar
Scheduling Click “Today’s Appointments” card or sidebar
Telemedicine Click “Telemedicine Sessions” card
Add Patient Click “Add Patient” quick action
New Appointment Click “Schedule Appointment” quick action
Business Profile Click profile completion banner

Mobile View

On mobile devices, the dashboard adapts:

  • Cards stack vertically
  • Sidebar becomes a hamburger menu
  • Quick actions remain accessible
  • Schedule shows condensed view

Access the sidebar by tapping the menu icon in the top-left corner.


Troubleshooting

Dashboard Not Loading

  1. Check your internet connection
  2. Try refreshing the page (F5 or Ctrl/Cmd + R)
  3. Clear browser cache
  4. Contact support if the issue persists

Missing Data

  • If stats show “0” unexpectedly, data may still be loading
  • Wait a few seconds for the page to fully load
  • Check if you’re viewing the correct organization (if you have multiple)

Alerts Not Dismissing

  • Some alerts require action to dismiss
  • Click on the alert to address the underlying issue
  • Once resolved, the alert will automatically disappear